

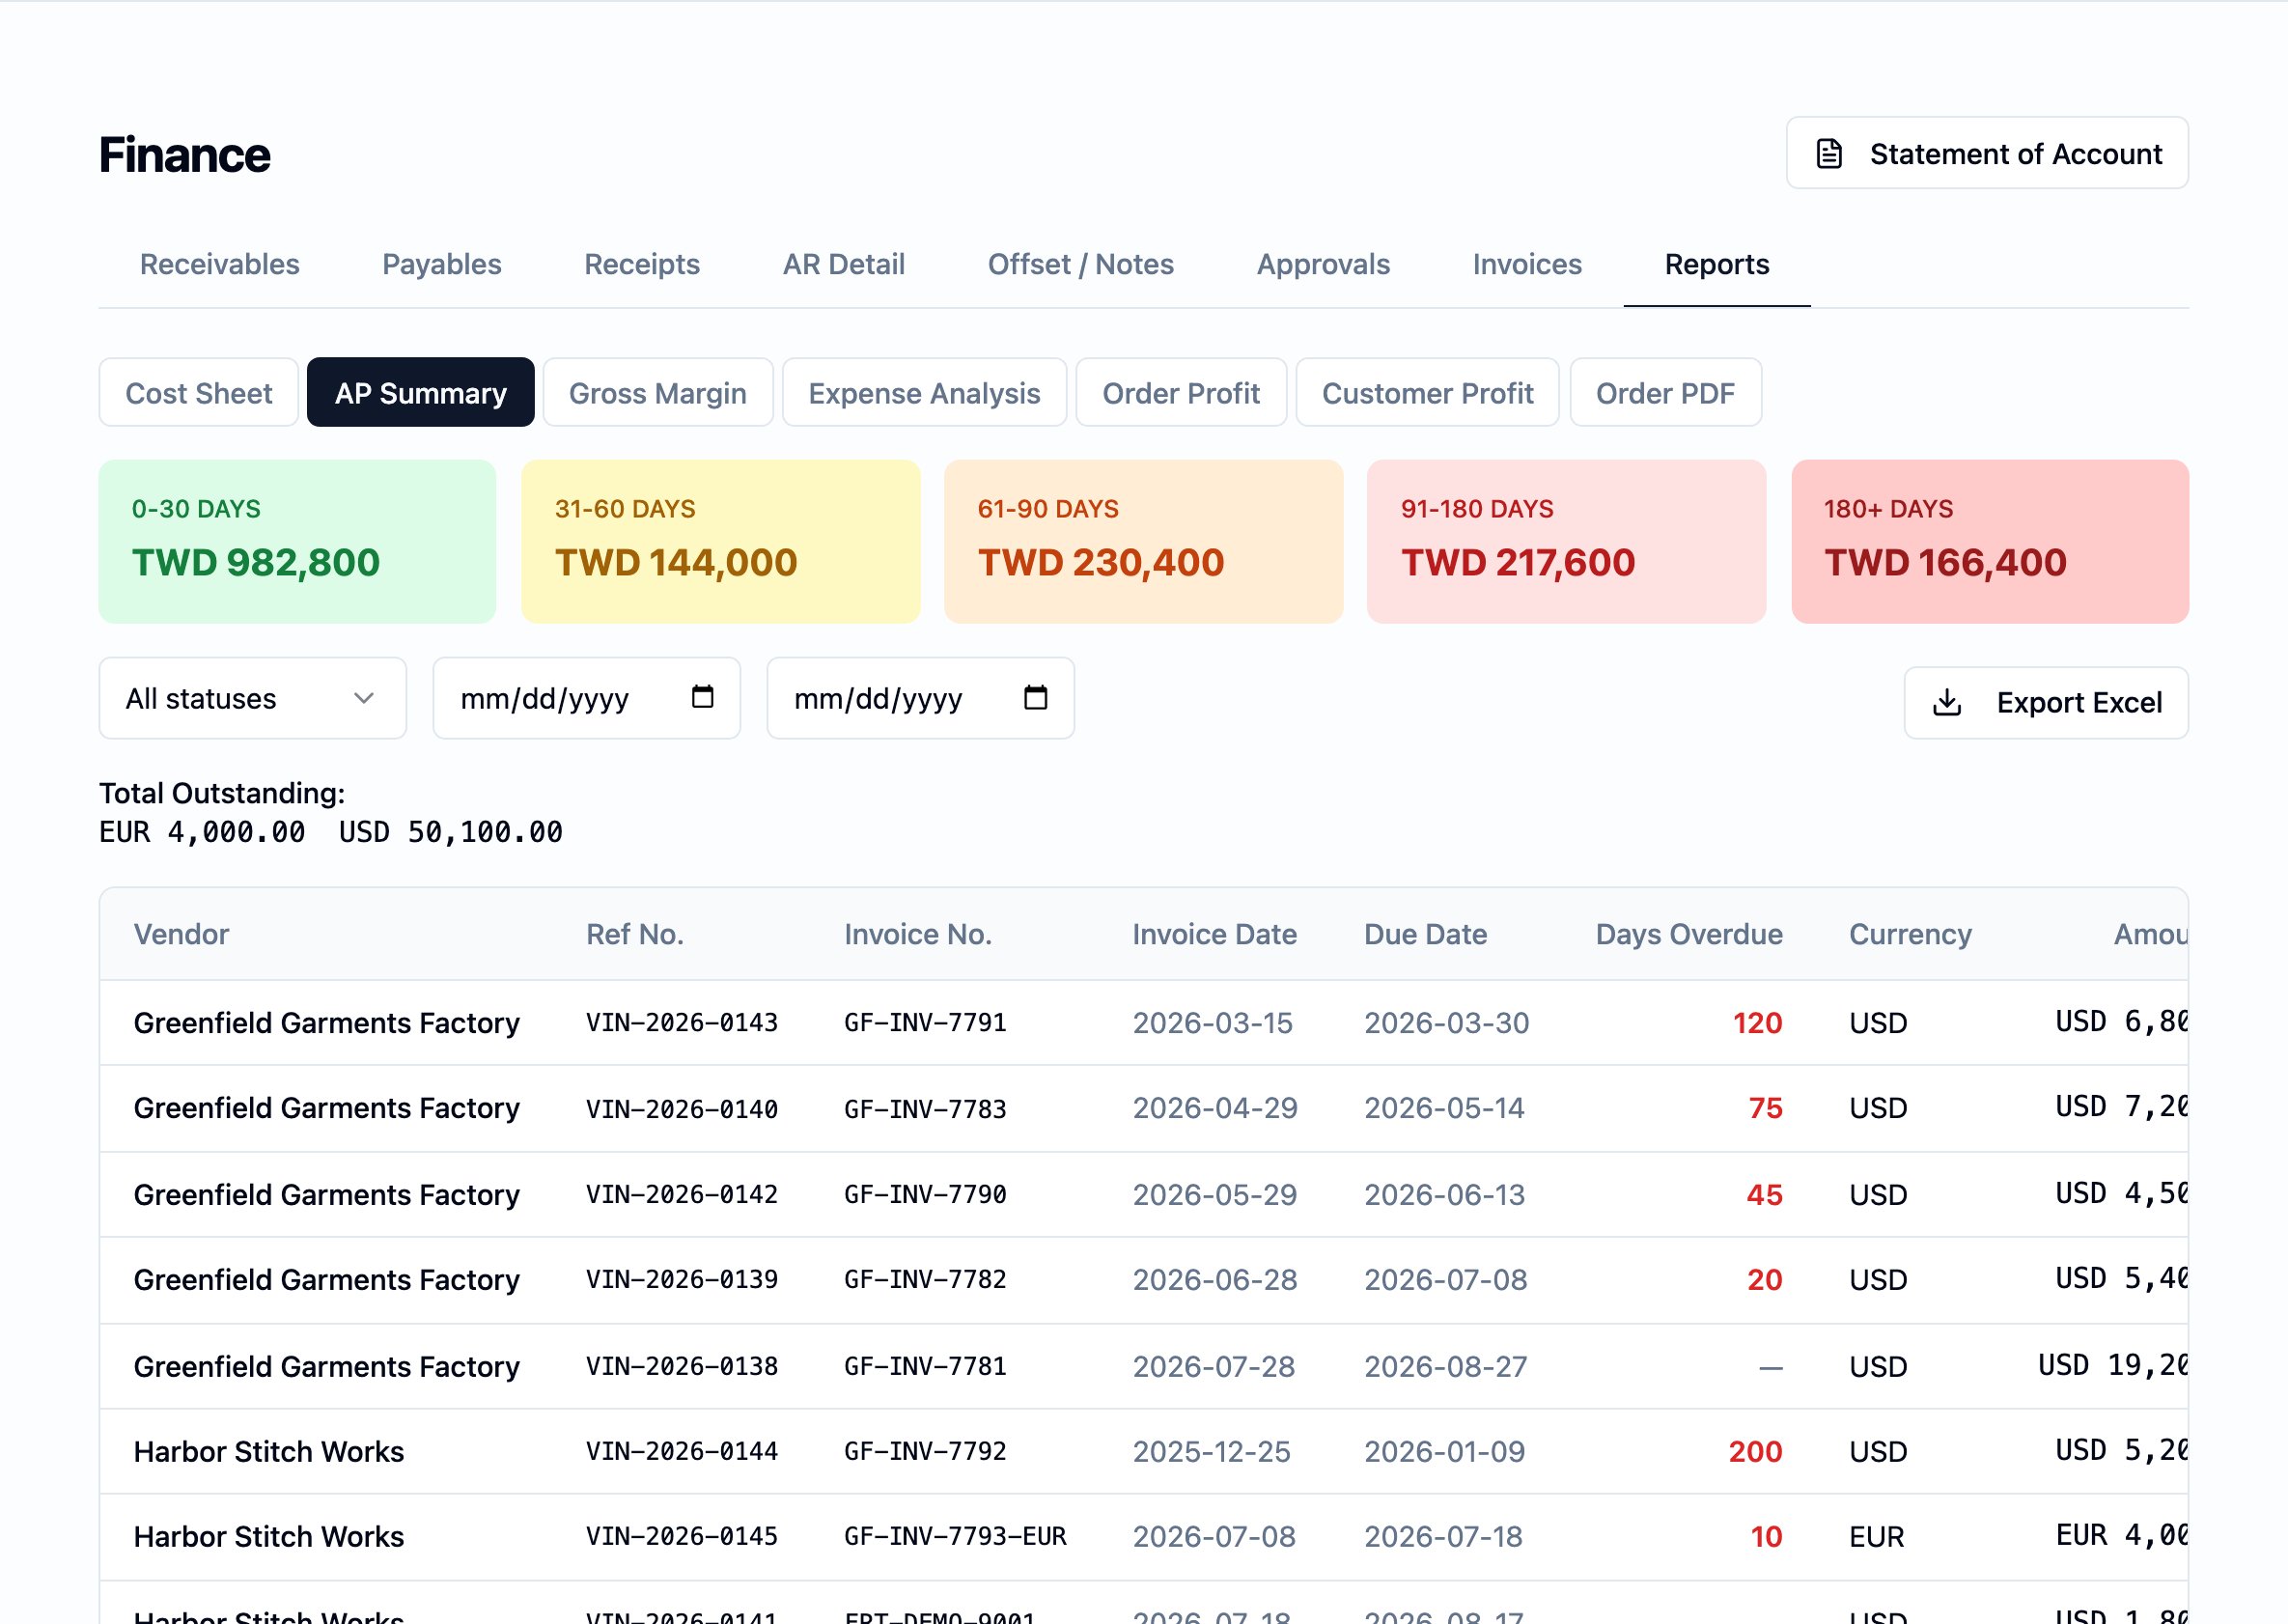
The Finance Reports tab opened to AP Summary — the aging buckets across the top, the period filters below, and the vendor-invoice detail that combines the workspace's open payables into one cross-period view.
What this tab is not
The Reports tab is one of several Finance surfaces. A reader who is looking for an everyday Finance figure usually wants a different surface:- The AR / AP aging boards — what is owed today and what is overdue — are not on the Reports tab. See Receivables and Payables.
- The customer statement (對帳單 / 請款單) is generated from the action button at the top of the Finance module, not from the Reports tab. See Statement of Account.
- AR Detail (應收明細) — a per-customer drill-down on open receivables — is its own tab on the Finance module.
- Recording a receipt or applying a deposit happens on the Receipts (收款) and Offset (沖帳) tabs, not on Reports.
The reports that ship
The Reports tab carries seven reports, in this order.Cost Sheet
A per-order cost build-up — for one order chosen by its order number, the detailed production-cost breakdown the workspace has recorded against the order’s styles, with the same line structure the cost sheet module uses. The report is the same view a finance reader needs to validate the cost basis of an order before settling its invoices. The team picks an order; the report renders the cost build-up and offers an Excel download. The report does not include the workspace’s profit or margin figures — it is a cost view, not a profit view. Who can see it. Every Finance role and Administrator and Supervisor. Merchandiser and Read-only users do not reach this report (the cost view is restricted from those roles in the same way it is on the cost-sheet module).AP Summary
A vendor-payables aging report — the workspace’s open payables, grouped by vendor, with the same age-band treatment the Payables board carries. The report exposes filters by date range, vendor, payment status, and shipping mode, so a reader can pull the slice they need (for example: a single freight forwarder’s open invoices in a specific month) without drilling into the board. The report exports to Excel.Gross Margin
A per-order revenue-vs.-direct-cost report — the order’s revenue alongside its production-cost basis, and the gross margin that falls out of the two. This is the direct-cost profit view: it does not apply the cost allocation overlay (no freight, inspection, or other non-production costs are loaded in), and is the right view when the question is purely “are we making margin on the goods themselves.” Filters cover date range, customer, and sales rep. The report exports to Excel. Who can see it. Restricted to Administrator, Supervisor, Finance, and Finance checker. Sales and Merchandiser users do not reach this report — it carries margin figures.Expense Analysis
A workspace-wide view of the non-production expense pool — the freight, inspection, customs, packaging, and testing costs the workspace has recorded — aggregated for analysis. The reader picks the grouping:- By cost type (default) — totals per category, so the team can see how much of the period’s expense went to freight versus inspection versus customs.
- By supplier — totals per vendor, so the team can see who the workspace’s largest expense suppliers were in the period.
- By period — totals per month, so the team can see the run-rate over time.
Order Profit and Customer Profit
The two profitability roll-ups the workspace produces from the cost allocation overlay.- Order Profit. One row per order — the order’s revenue, direct production cost, allocated non-production cost, loaded cost (direct + allocated), profit, and the margin percentage off revenue. Limited to revenue-bearing orders (Confirmed and further along, excluding Cancelled).
- Customer Profit. One row per customer, aggregated from each customer’s revenue-bearing orders — the same figures rolled up.
Order PDF
A PDF rendering of an order’s cost sheet, for sharing or filing. The report is the PDF form of the Cost Sheet sub-tab and is restricted to the same set of roles.How exports work
Every report on this tab offers an Excel download; Expense Analysis offers CSV as well. The download is what the report shows on screen, in the same order and the same filtering — no separate export shape and no figures the on-screen view does not also carry. The downloaded file is intended for the team’s own use. The customer-facing Statement of Account is produced from its own action and has its own download set (PDF, Excel, CSV); the Reports tab exports are the workspace’s internal reading. For workspaces that hand off finance movements to an external bookkeeping system, the platform also produces the 正航 / ChengHang T357 voucher export — a separate, back-office handoff that is not part of the Reports tab.Roles and visibility
The Reports tab itself is reachable wherever the Finance module is — by the roles that reach the module: Administrator, Supervisor, Finance, and Finance checker. The reports inside the tab apply the role rules named above:- Cost Sheet and Order PDF — Administrator, Supervisor, Finance, Finance checker. Not available to Merchandiser or Read-only.
- Gross Margin, Expense Analysis, Order Profit, and Customer Profit — Administrator, Supervisor, Finance, Finance checker only. Sales and Merchandiser users do not reach these reports.
- AP Summary — available to the Finance-module roles above.